
Where London’s Housing Market Held Up in Q2
Postcode-level insights from the Q2 2025 data

In Q2 2025, the London property market continued to cool. The median price per square metre (psm) slipped by 0.7%, while the number of transactions collapsed by 65% compared with Q2 2024.
This article provides a postcode-level analysis of the London housing market in Q2 2025, including maps of price changes and sales volumes across the city. While the South East appears to have led on price growth, the picture looks different when adjusted for the sharp fall in activity — with Putney (SW6), Streatham (SW16), and Chingford (E4) showing the most resilience in an otherwise slowing market.
South East London Outperforms on Price Growth
The first map shows London price changes per square metre between Q2 2024 and Q2 2025. The South East clearly stands out, with several postcodes showing solid year-on-year increases despite the wider slowdown.
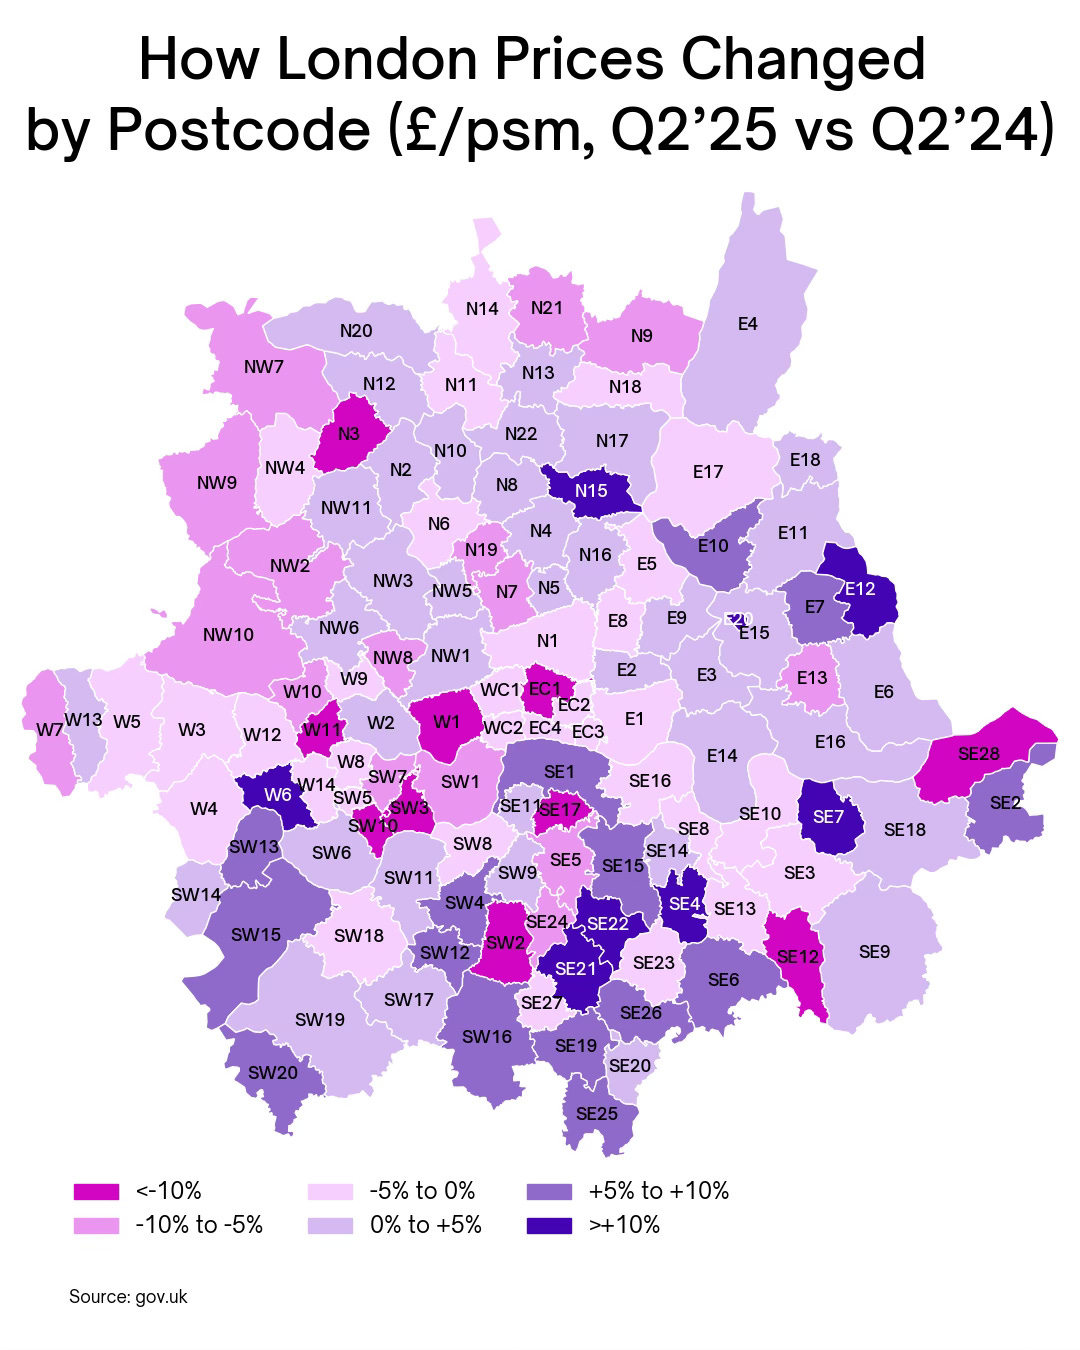
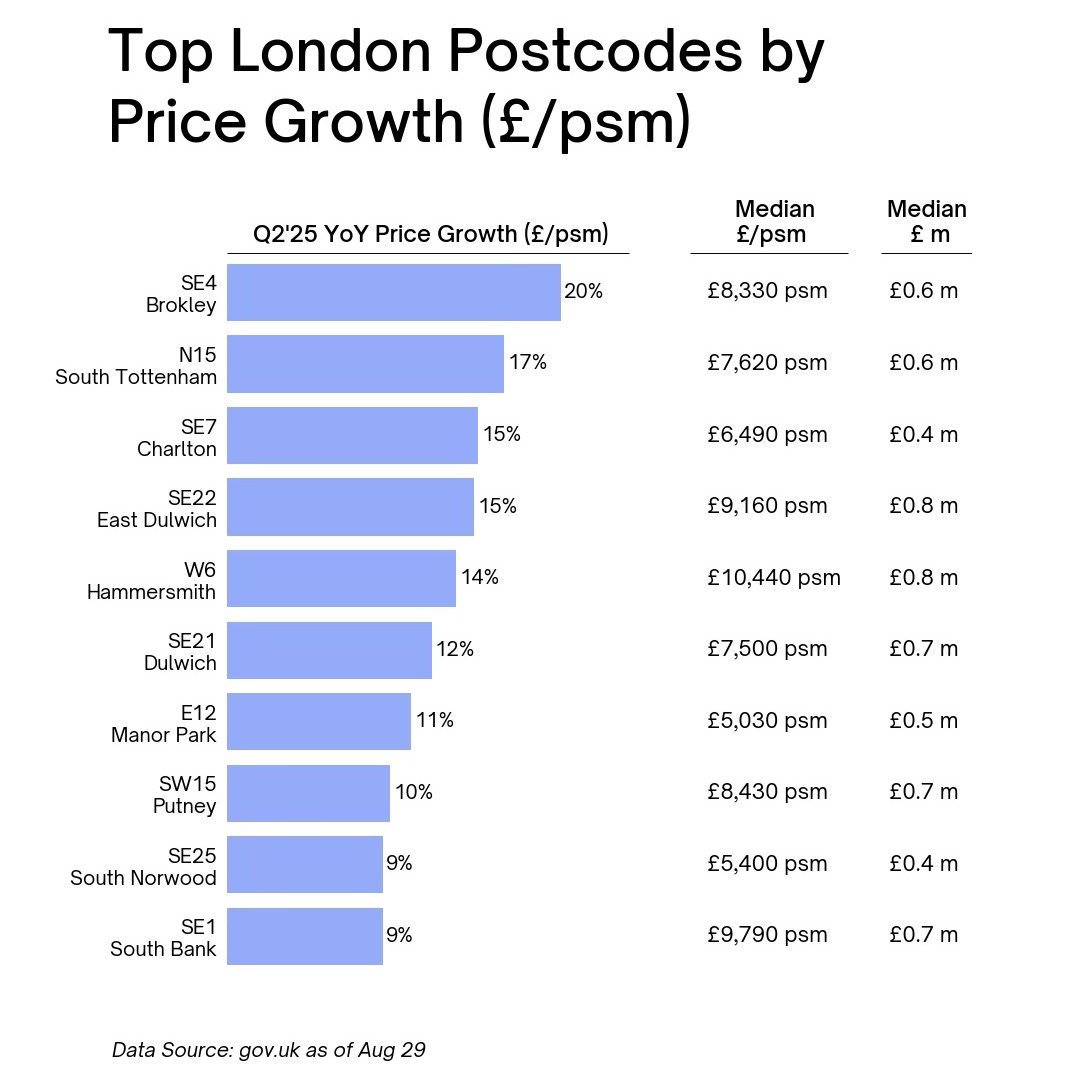
Among the top 10 fastest-growing postcodes, six are in the South East.
Slower Areas Spread Across the City
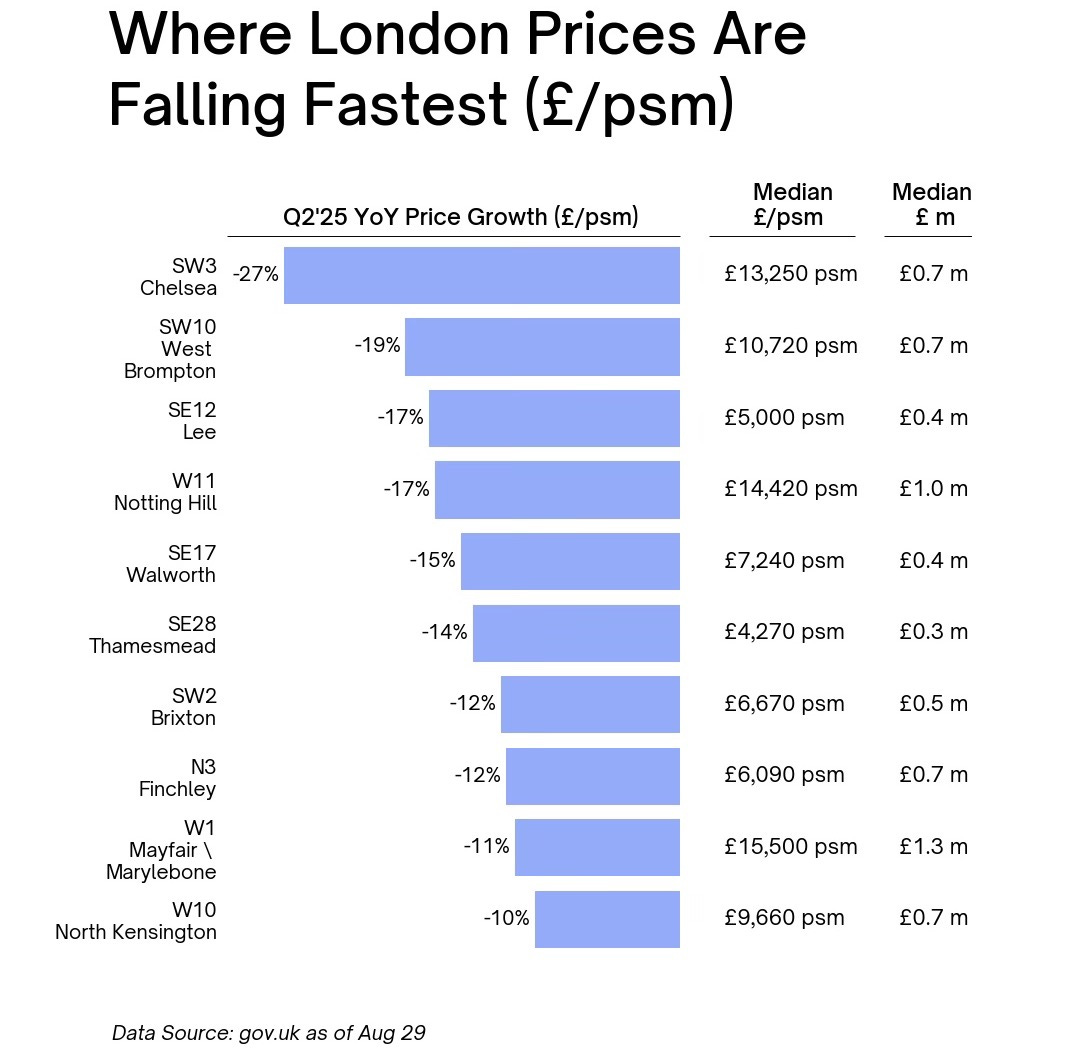
The bottom 10 postcodes for price performance present a mixed picture, scattered across the capital and across various price brackets. This underlines how uneven the slowdown has become — no single area is immune.
Transaction Volumes Reveal a City-Wide Freeze
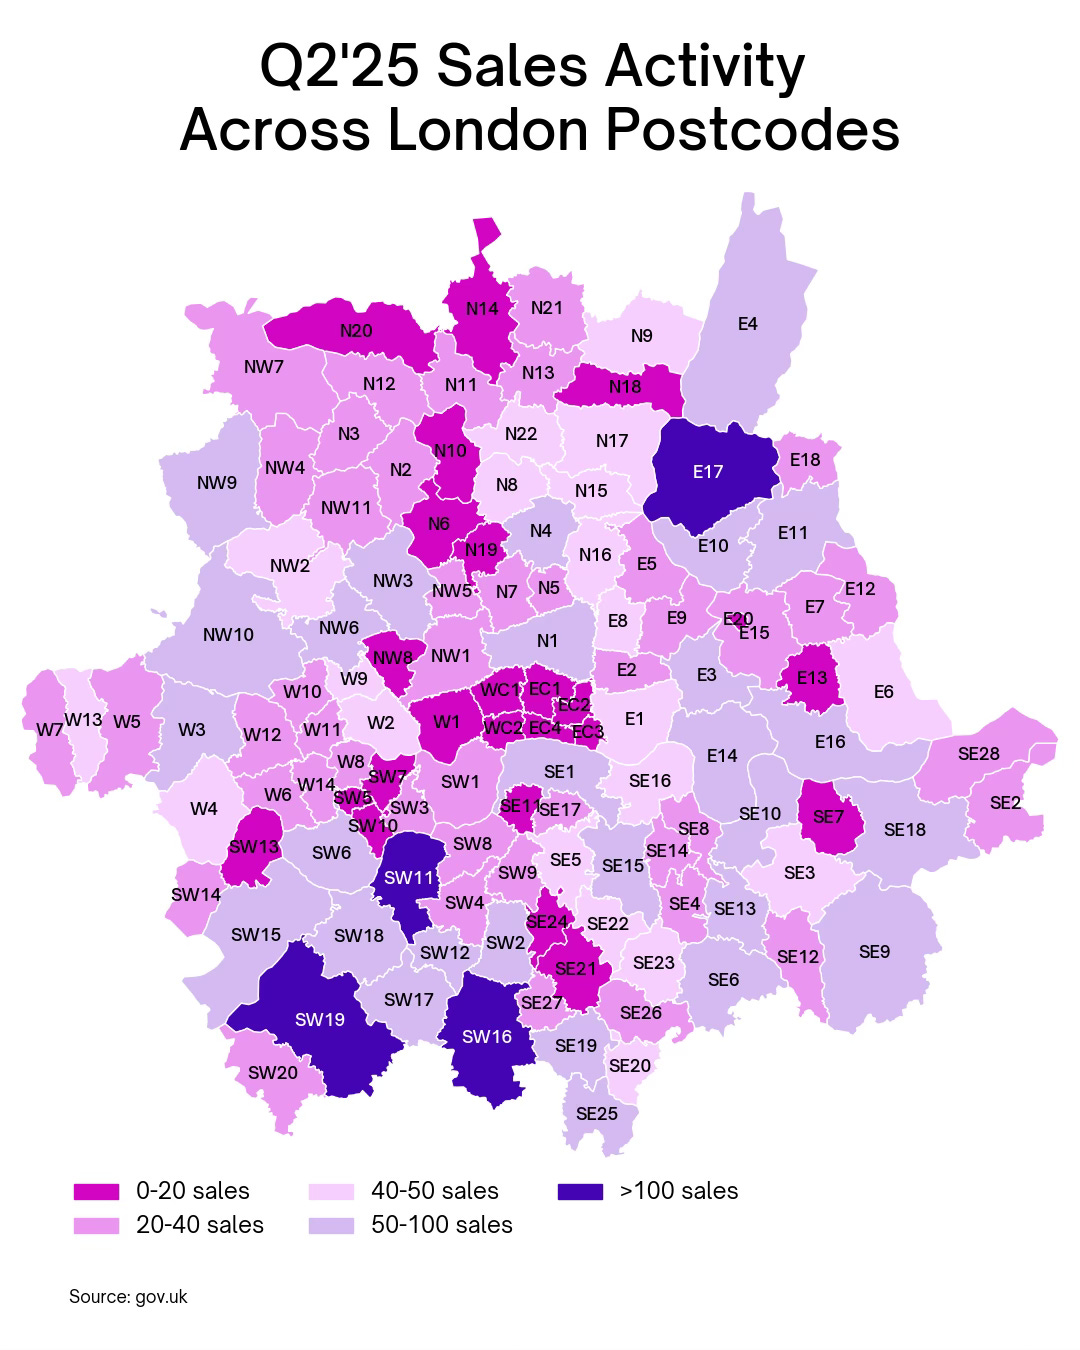
When we turn to sales volumes by postcode, the slowdown becomes even more visible. The map below shows a large number of postcodes with fewer than 40 transactions in Q2 2025.
While the South East leads in price growth, the South West shows stronger liquidity, with more postcodes maintaining moderate levels of activity.
Liquidity vs. Price Growth: Finding True Resilience
To make sense of the falling volumes and uneven price movements, I ranked all postcodes by the number of transactions to identify the 10 most active areas. Even in these markets, sales volumes dropped 50–70% year-on-year, which makes positive price growth difficult to read as true market strength.
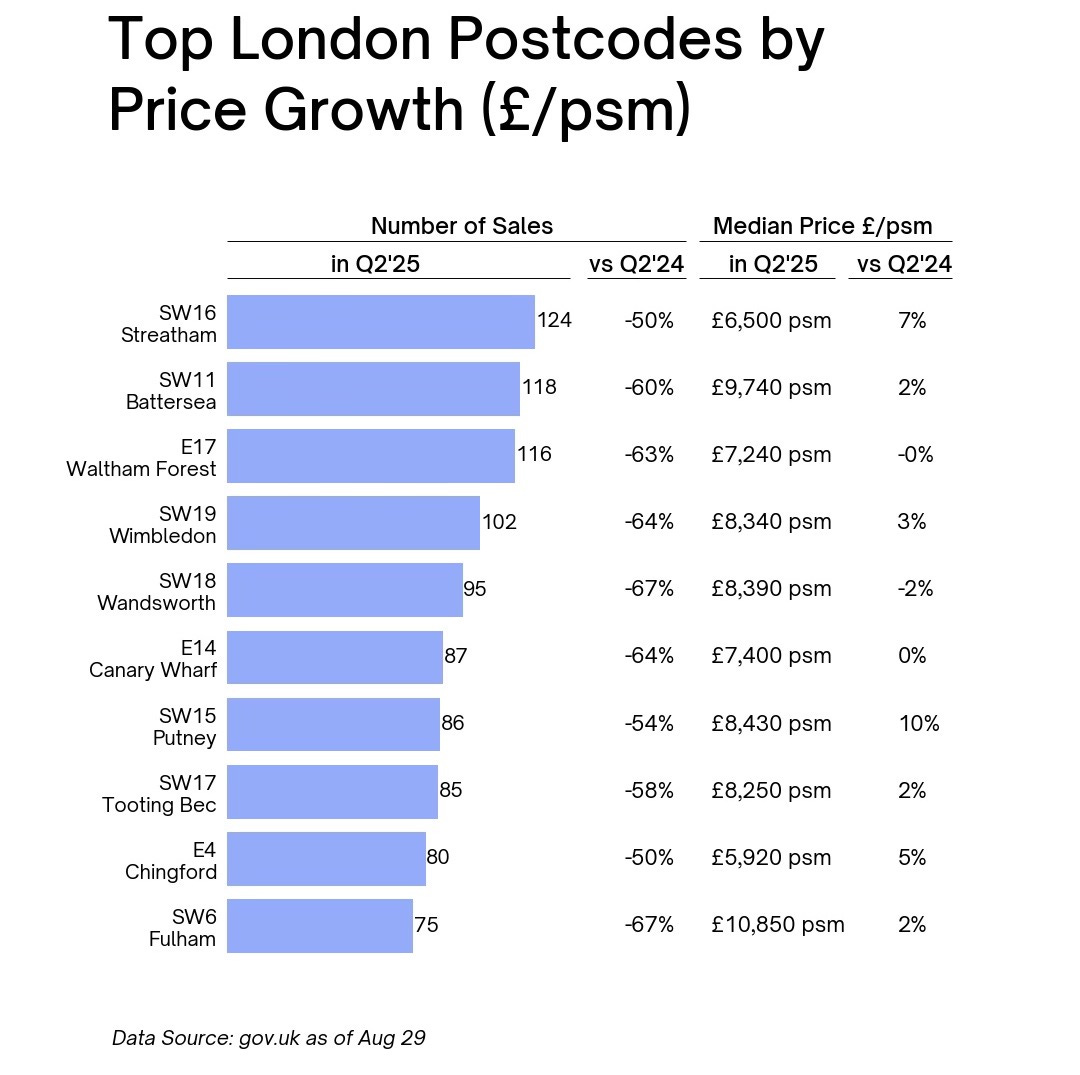
Still, a few postcodes stand out for showing relative resilience despite the broader slowdown:
• Putney (SW6): +10% price growth, sales down ~50%
• Streatham (SW16): +7% price growth, sales down ~55%
• Chingford (E4): +5% price growth, sales down ~53%
These areas managed to hold prices steady while experiencing less severe declines in activity than most of the city. This suggests that well-connected, mid-market suburbs may be better positioned to weather London’s housing slowdown.